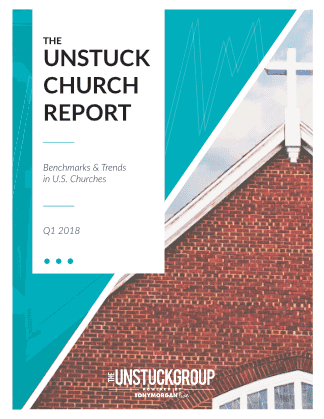
The Unstuck Church Report:
Benchmarks & Trends in U.S. Churches Q1 2018.
At the beginning of last quarter, my team and I at The Unstuck Group released our first edition of The Unstuck Church Report. The response was enormous. I’m encouraged by that fact—I hope it indicates more church leaders are interested in using metrics to track the health of their church, rather than relying too heavily on their sense of how things are going on any given day.
Today we have an updated edition for you, The Unstuck Church Report: Benchmarks & Trends in U.S. Churches Q1 2018.
There were some encouraging trends this time around. For example, in the last 12 months, churches we have data on baptized 6.6% of their total attendance, increasing from the previous quarter. Despite people attending church less frequently, this shows people are still being reached and lives are being changed.
In the last 12 months, churches we have data on baptized 6.6% of their total attendance, increasing from the previous quarter. | The Unstuck Church Report Share on XThere were also some less encouraging trends, like the fact that churches average having the equivalent of 17 weeks in cash reserves. That’s well beyond the six to eight weeks that The Unstuck Group recommends. This suggests churches are generally in a healthy financial position to invest in expanded Kingdom initiatives… but aren’t doing so. There’s money sitting in banks that could be invested to reach more people for Jesus.
Churches averaged 17 weeks in cash reserves. This suggests churches are in a healthy financial position to invest in expanded Kingdom initiatives… but aren’t doing so. | The Unstuck Church Report Share on XIn the full report, you’ll find metrics, trends and some of my observations about the data related to Ministry Reach, Staffing and Leadership, Connection, and Finances. Download the latest edition today. It’s free. And, you can opt-in to get free quarterly updates by email.
 Here are a few questions you can expect the report to answer:
- Has the overall attendance increased or decreased?
- What percentage of churches have gone multisite?
- How much are people giving?
- What is the average volunteer engagement?
- What percentage of the budget are churches spending on staffing?
Download the Q1 2018 edition for more metrics and observations. I hope awareness of these metrics will provide you with knowledge and courage to take the necessary leadership steps towards church health.


 Here are a few questions you can expect the report to answer:


Leave a Reply